Using Google Analytics with Articulate Storyline
Updated on
Did you know you can use Google Analytics to track screen views and events in your Articulate Storyline courses? You may want to use this highly customizable approach as an alternative, or in addition to, the data provided by your learning management system (LMS) or learning record store (LRS).
This post and example course describes how to implement screen and event tracking in your Articulate Storyline project using the Execute Javascript trigger.
Screen tracking
Measuring screen views allows you to see which slides are being viewed most by your users, and how are they are navigating between different slides.
The Execute JavaScript trigger can be used to track screen views when the timeline starts. Use the script below on each slide you’d like to track. Update the screenName attribute with the title of the slide.
ga('send', 'screenview', {screenName: 'Welcome'});Event tracking
Events are user interactions with content that can be measured independently from a screen view. Interactions with buttons, questions, and video are all examples of actions you might want to measure as Events.
The following command sends an event to Google Analytics indicating that the Test Button button was clicked.
ga('send', 'event', 'Button', 'click', 'Test Button');Events in Google Analytics have a category, action, and label. For the above example, the category is Button; the action is click; the label is Test Button. For a more in-depth description of each of these fields, see Anatomy of an Event in the Google Analytics Help Center.
The Execute JavaScript trigger can be used to track when the user clicks on a button. Use the script above on each button you’d like to track. Update the label value to match the label of the button that you’re tracking.
Tracking questions
Use events for tracking the results of questions. For this example, the category is Question; the action is correct or incorrect; the label is Question 1.
In this example, the Execute JavaScript trigger is used to send an event when the timeline starts on the Correct and Incorrect layers. The label for the event corresponds with the question title.
ga('send', 'event', 'Question', 'correct', 'Question 1');Tracking results
Similar to the example above, use the Execute JavaScript trigger to send an event when the timeline starts on the Pass and Fail layers of a results slide.
ga('send', 'event', 'Result', 'pass');If you’re using multiple results slides, include the event label field to indicate the name of the results slide.
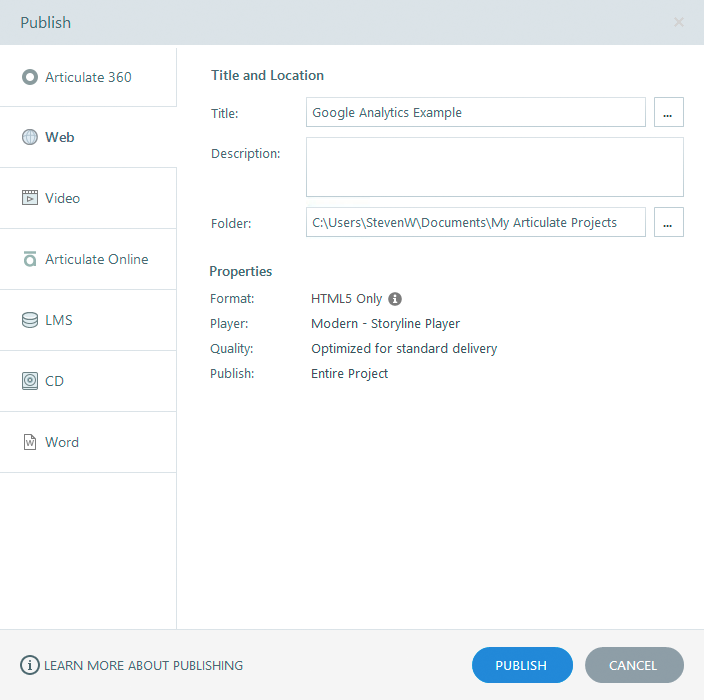
ga('send', 'event', 'Result', 'fail', 'Quiz 1');Publishing
You’ll need to publish your course for Web or LMS in order to add the Google Analytics site tag.
Creating a Google Analytics property
Follow these steps to create a new Google Analytics property for your course:
- Sign in to your Google Analytics account.
- Click Admin.
- In the PROPERTY column, select Create new property from the dropdown menu.
- Select Website.
- Provide a Website Name. You may use the name of your course.
- Provide a Website URL. You may use your company URL.
- Click Get Tracking ID.
- In the VIEW column, select Create new view from the dropdown menu.
- Select Mobile app.
- Provide a Reporting View Name. You may use “All Mobile App Data”.
- Click Create View.
Adding analytics.js to your Storyline course
Next, you’ll need to add the Google Analytics tag to the story_html5.html file. Paste the code below directly above the </head> tag. Replace UA-XXXXXXXX-X with your Google Analytics ID. Replace Google Analytics Example with the name of your course. See the screenshot below.
<script>
  window.ga=window.ga||function(){(ga.q=ga.q||[]).push(arguments)};ga.l=+new Date;
  ga('create', 'UA-XXXXXXXX-X', 'auto');
  ga('set', 'appName', 'Google Analytics Example');
</script>
<script async src="https://www.google-analytics.com/analytics.js"></script>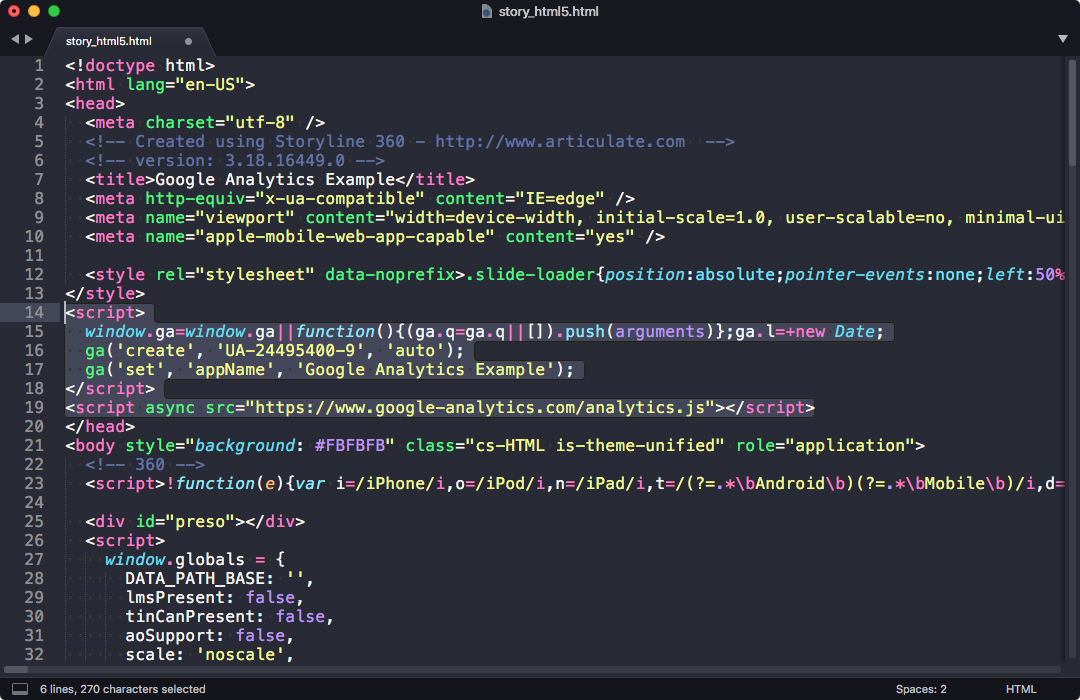
story_html5.html to add the Google Analytics tracking code to your Storyline course.
Google Analytics reports
After adding analytics.js to your Storyline course and uploading to your web server or LMS, you should be able to access your course and see that your screen view is being registered in the Real-Time reports.
To view the screen views report, click on the Behavior menu item and select Screens.
To view the events report, click on the Behavior menu item and select Top Events.