How to use the Dividend Income Portfolio Template for Apple Numbers
Updated on
This article describes how to get started with the Dividend Income Portfolio Template for Apple Numbers. This spreadsheet uses the STOCK function to retrieve stock information from the internet and automatically calculate the amount invested, value, capital gains and losses, and annual dividend income.
Removing sample data
The template includes sample data to demonstrate the usage of the template, and to show how the template should look and function after data has been entered.
To clear sample data from the Portfolio sheet, do the following:
- Select the rows with sample data (rows 2 through 21). To select multiple rows, click on the first row number, hold the shift key, then click the last row number.
- Right-click on any of the row numbers of the selected rows to reveal the context menu.
- Select the Delete Selected Rows menu item.
Switch sheets by clicking the Transactions tab. Follow the same approach to clear sample data from the Transactions sheet:
- Select the rows with sample data. To select multiple rows, click on the first row number, hold the shift key, then click the last row number.
- Right-click on any of the row numbers of the selected rows to reveal the context menu.
- Select the Delete Selected Rows menu item.
Using the Transactions sheet
In order to support multiple purchases over time, the template offers a Transactions sheet for tracking when you buy or sell stocks. The formulas in the Portfolio sheet use the transactions you enter here to calculate your total shares, average price, and cost basis.
To enter a new transaction, find the next available row in the Transactions sheet and enter the following data:
- For the Date column, enter the purchase date.
- For the Type column, select either “Bought” or “Sold”.
- For the Shares column, enter the number of shares bought or sold.
- For the Symbol column, enter the ticker symbol (e.g. AAPL).
- For the Price column, enter the purchase price.
- For the Commission column, enter the commission that you paid to buy or sell the equity. If you’re not sure what to enter here, leave the cell blank or enter 0.
After you’ve entered at least one transaction, you’re ready to move on to the Portfolio sheet.
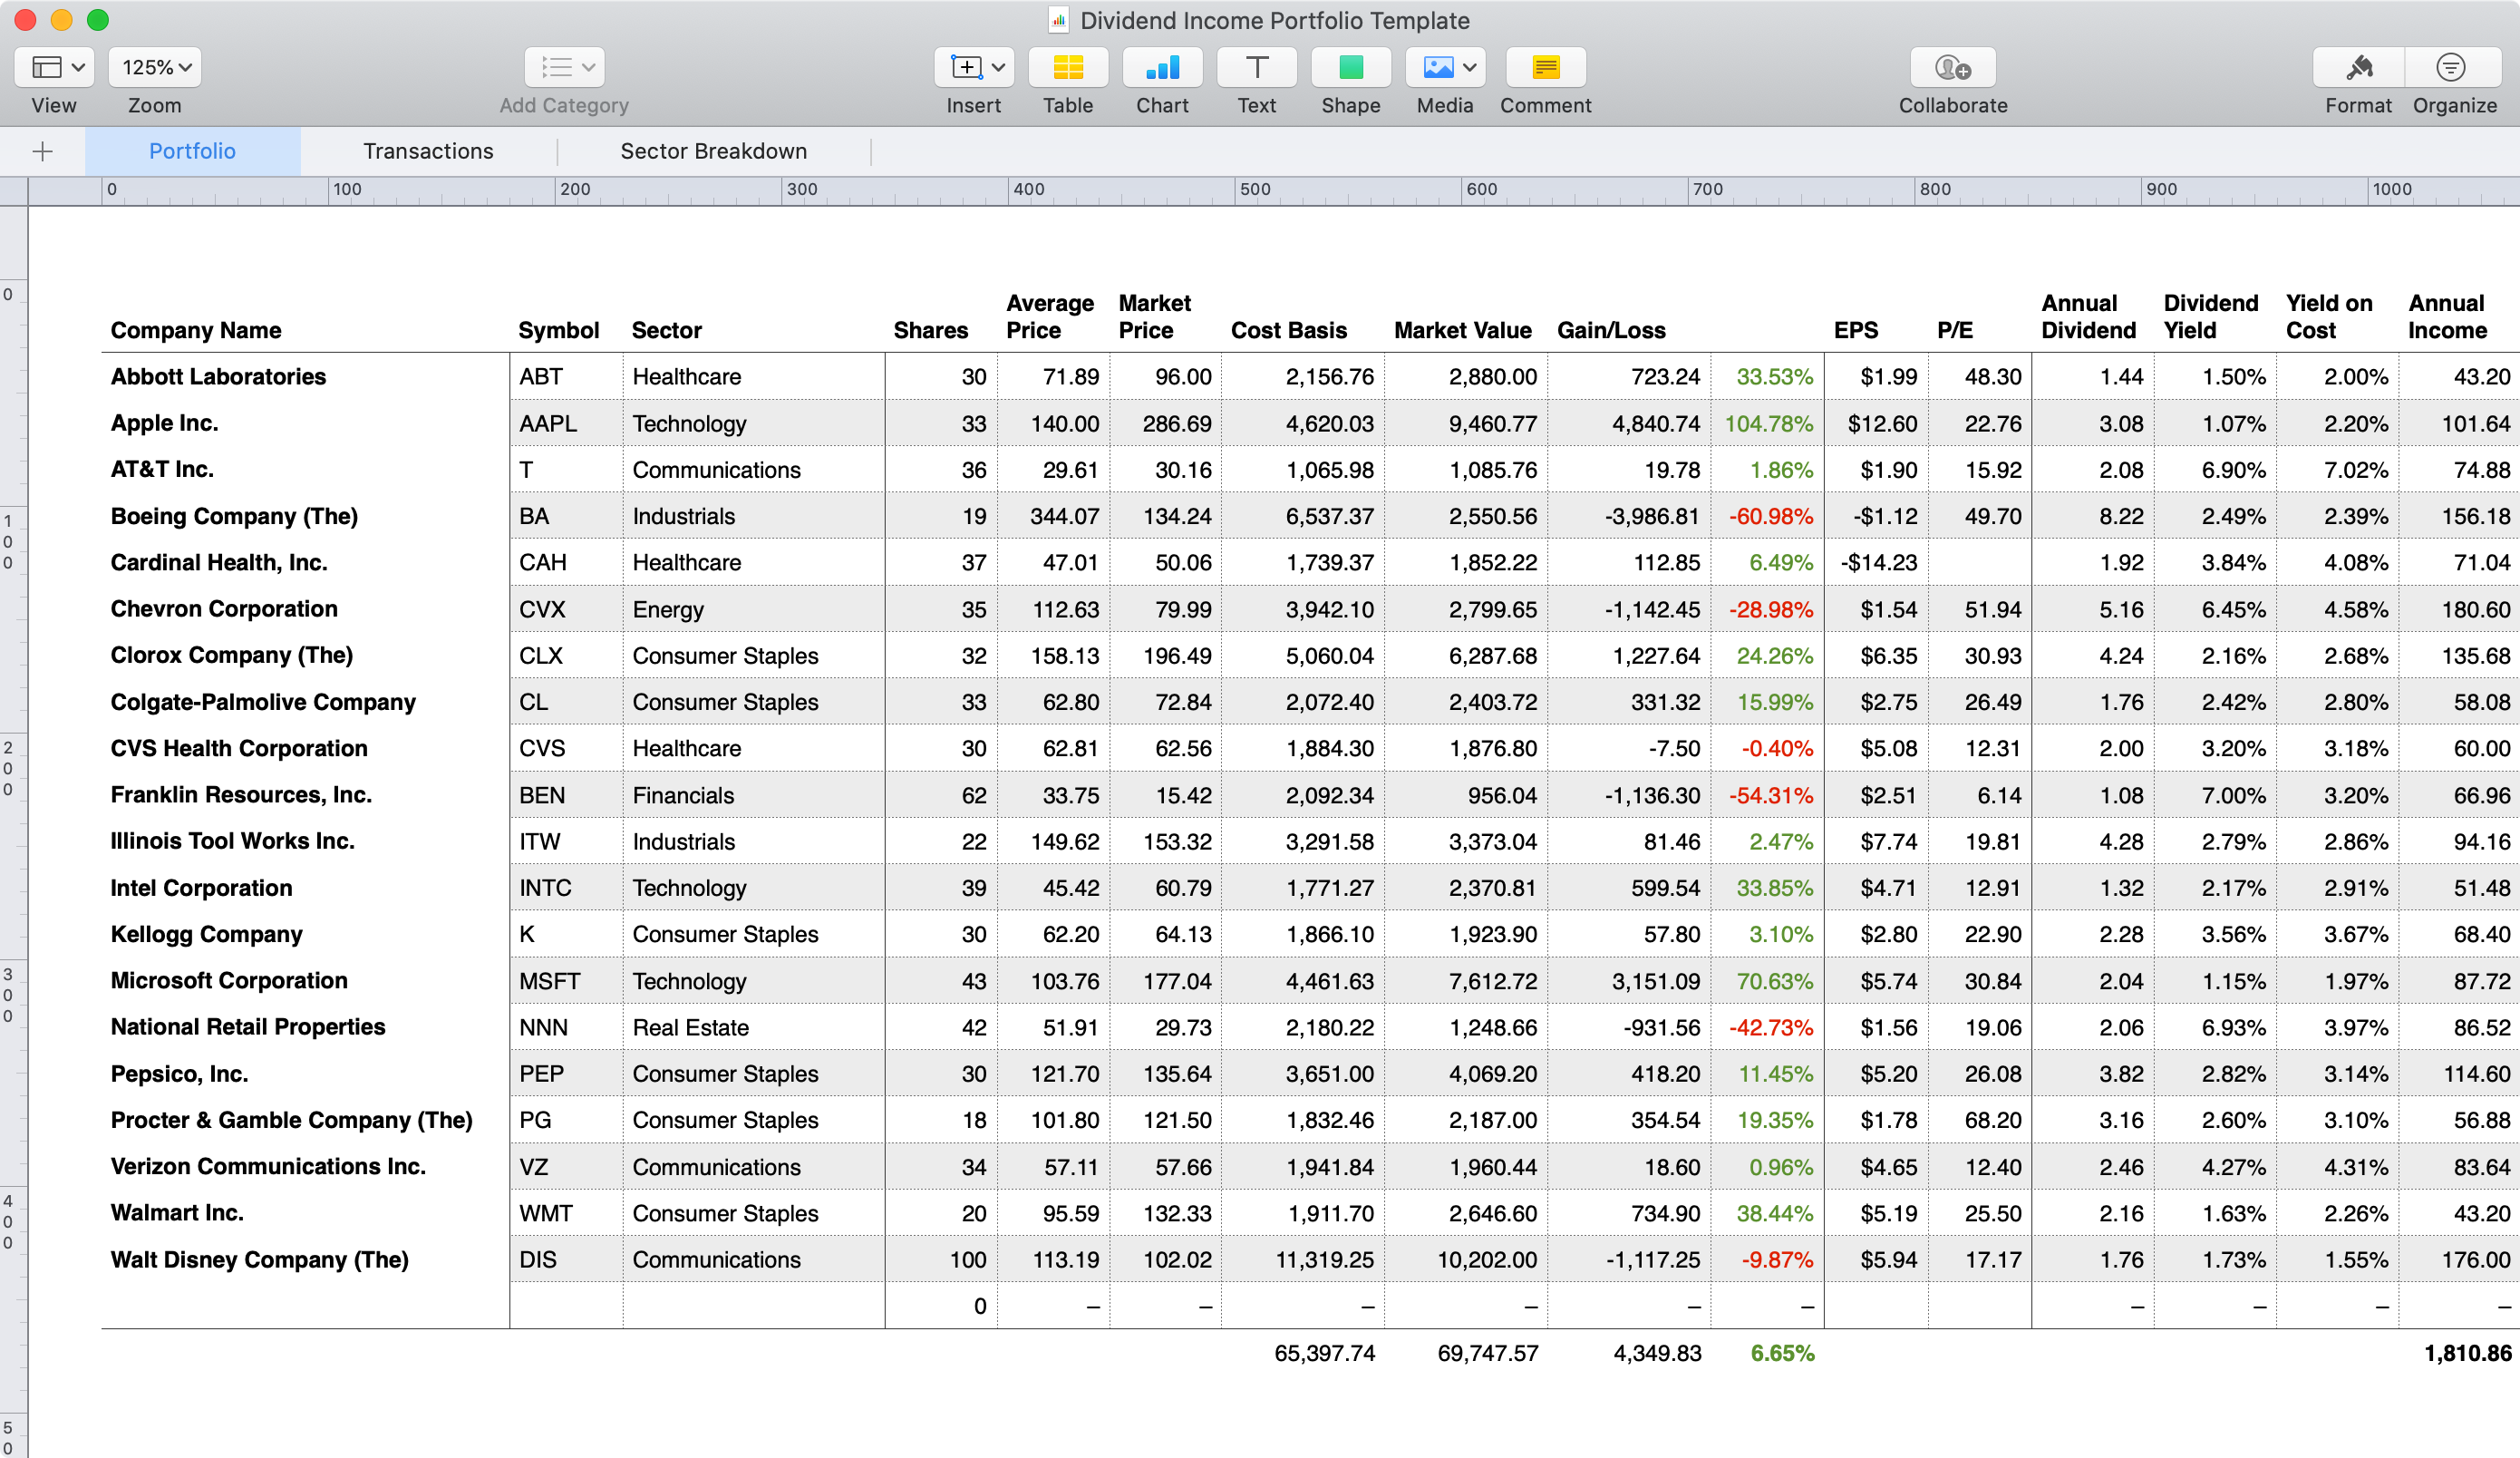
Using the Portfolio sheet
After entering your transactions, you only need to enter the symbol into the Portfolio sheet. After entering the symbol, you should see the values immediately update to reflect the transactions you’ve entered. The symbols you enter must match the symbols used in the transactions sheet.
The Sector dropdown is optional, but selecting a value here will enable the Sector Breakdown sheet to display the percent and amount invested by market sector.
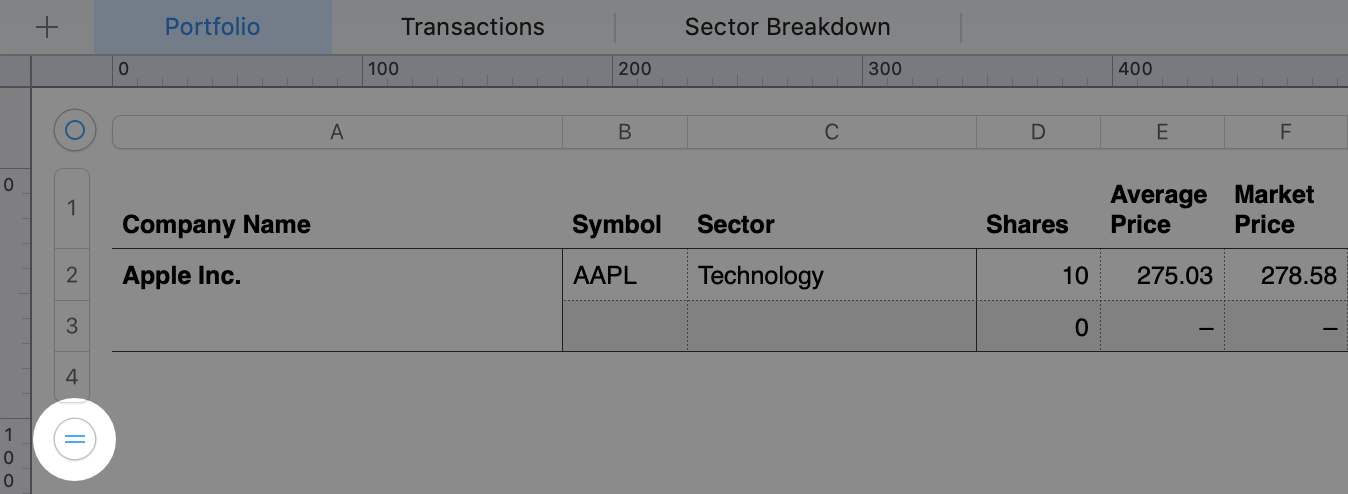
Adding rows
To add new rows to any sheet, click the button indicated in the screenshot below. You may also click and drag to create multiple rows. The formulas from the above cells are copied down automatically.
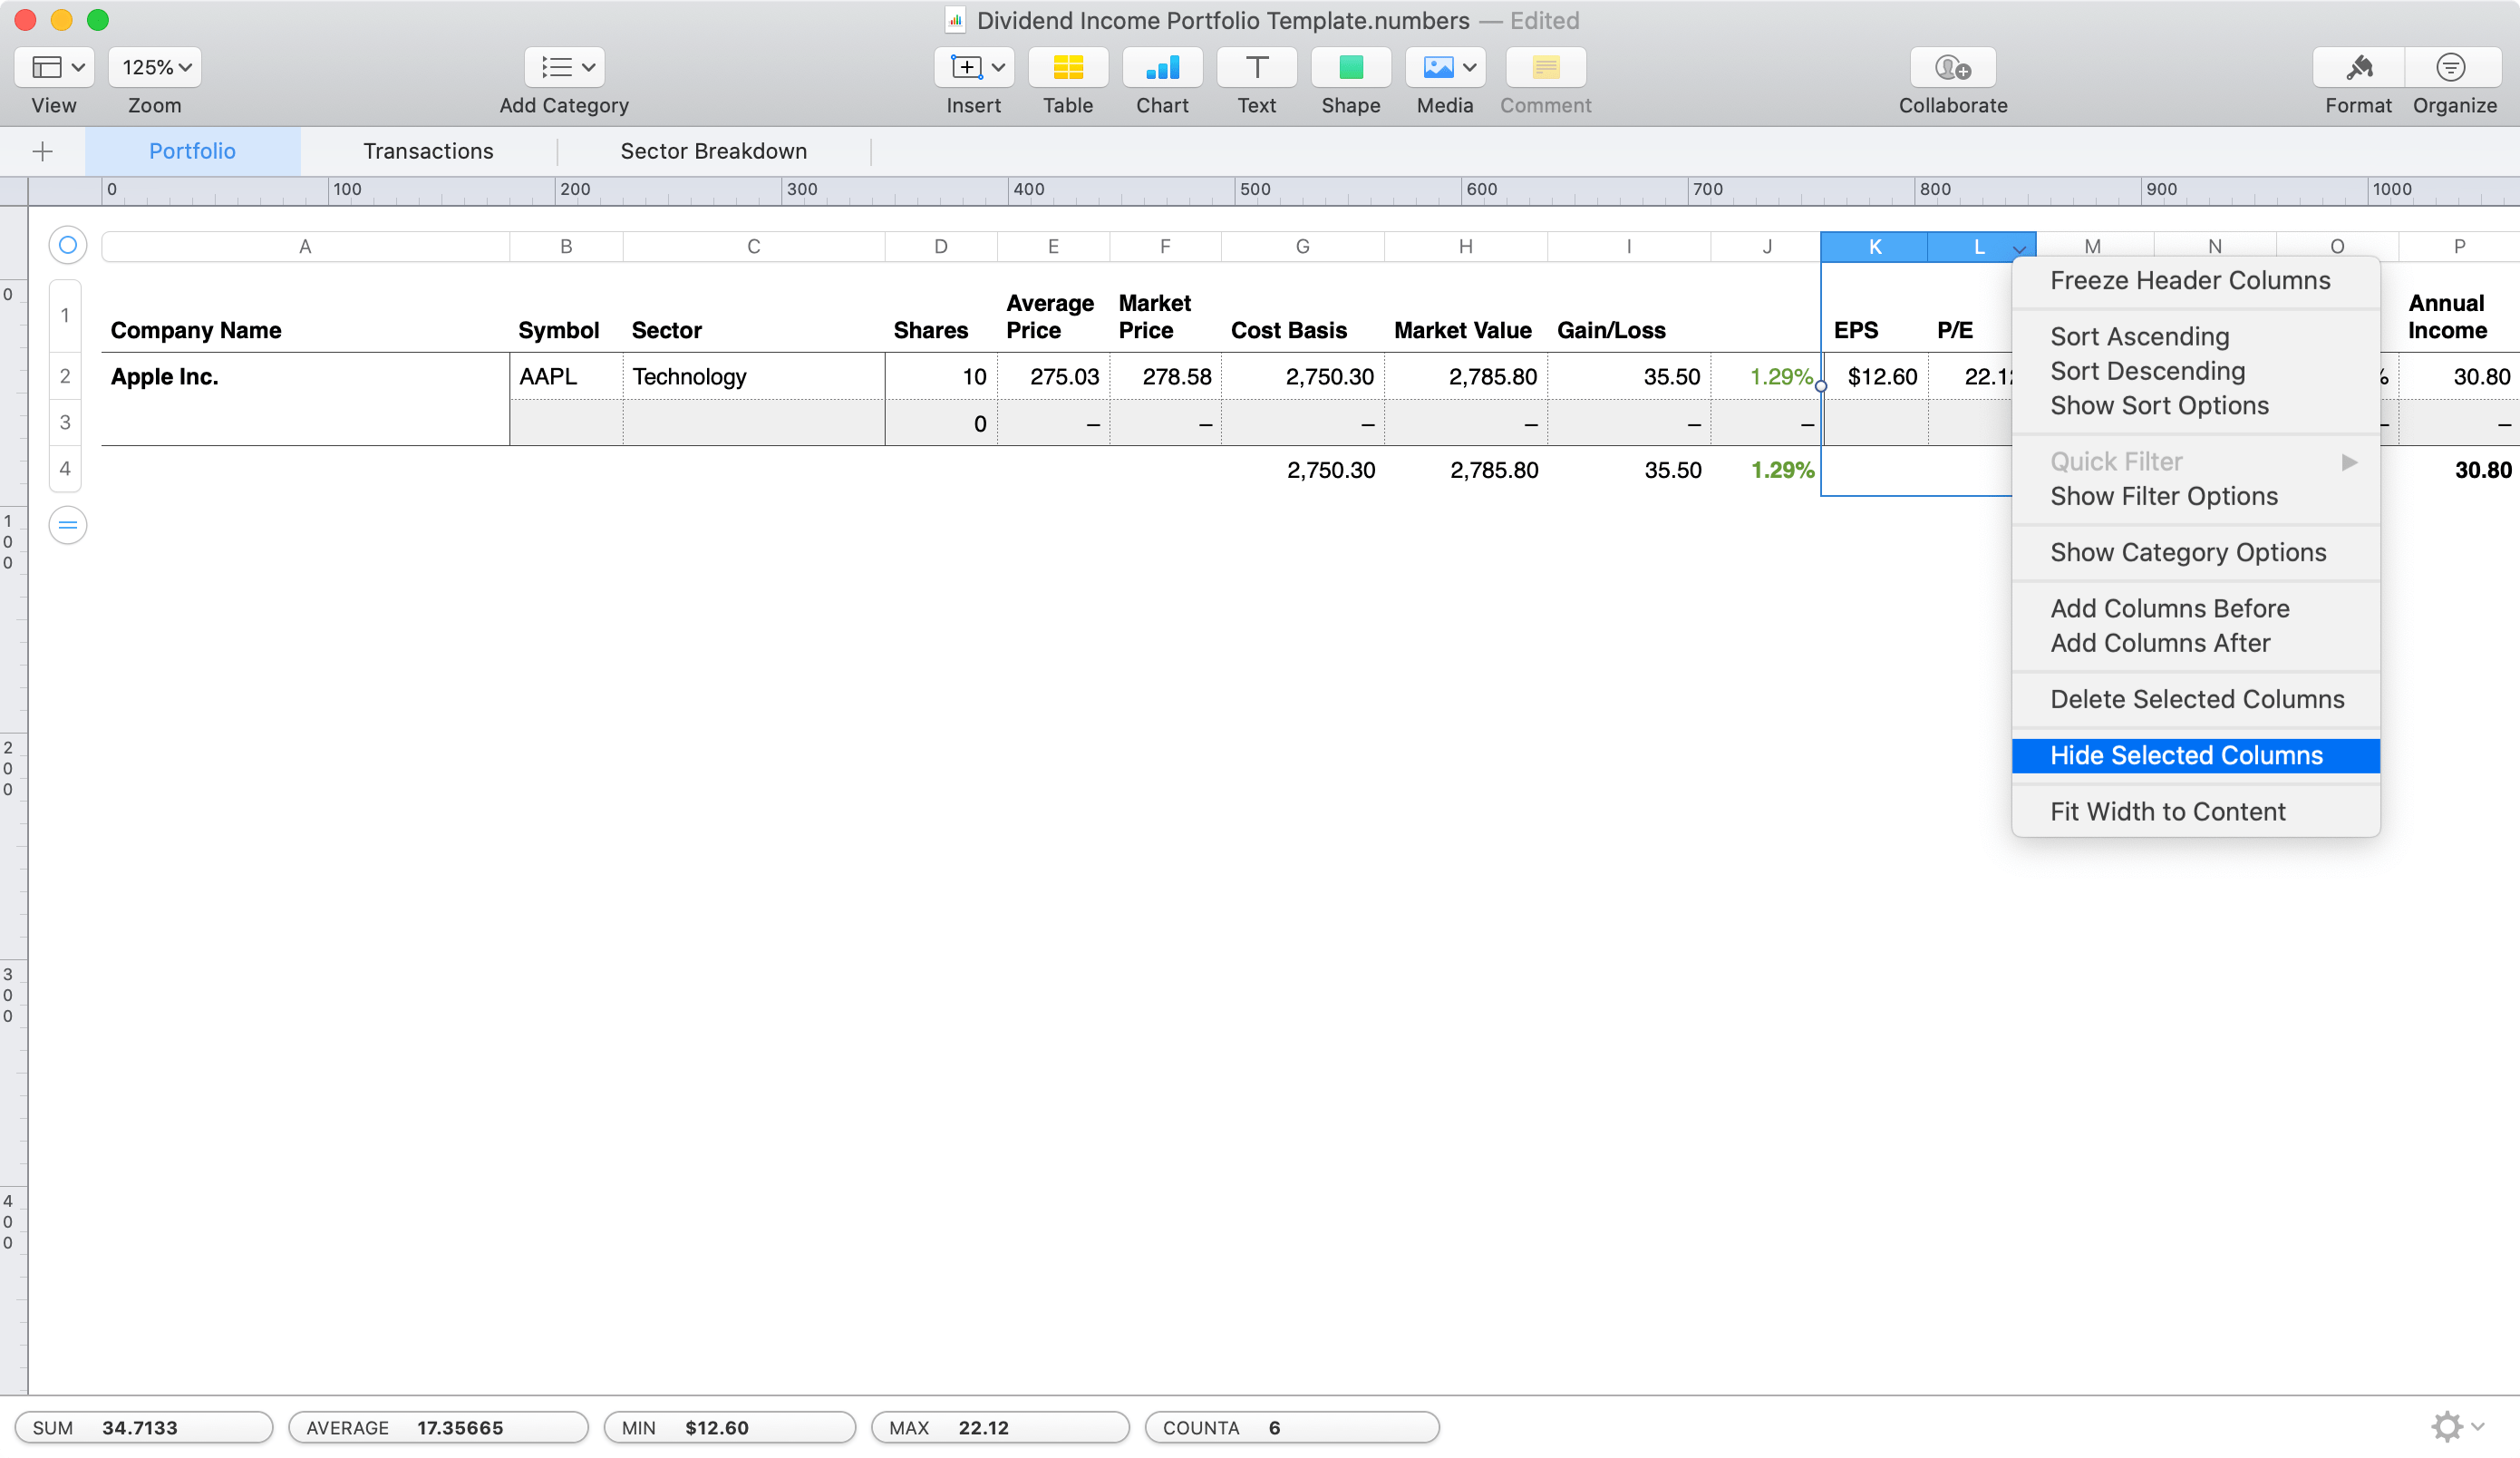
Hiding columns
To hide columns, right-click the column header and select the Hide Selected Columns menu item. Hold the shift key to select multiple columns.
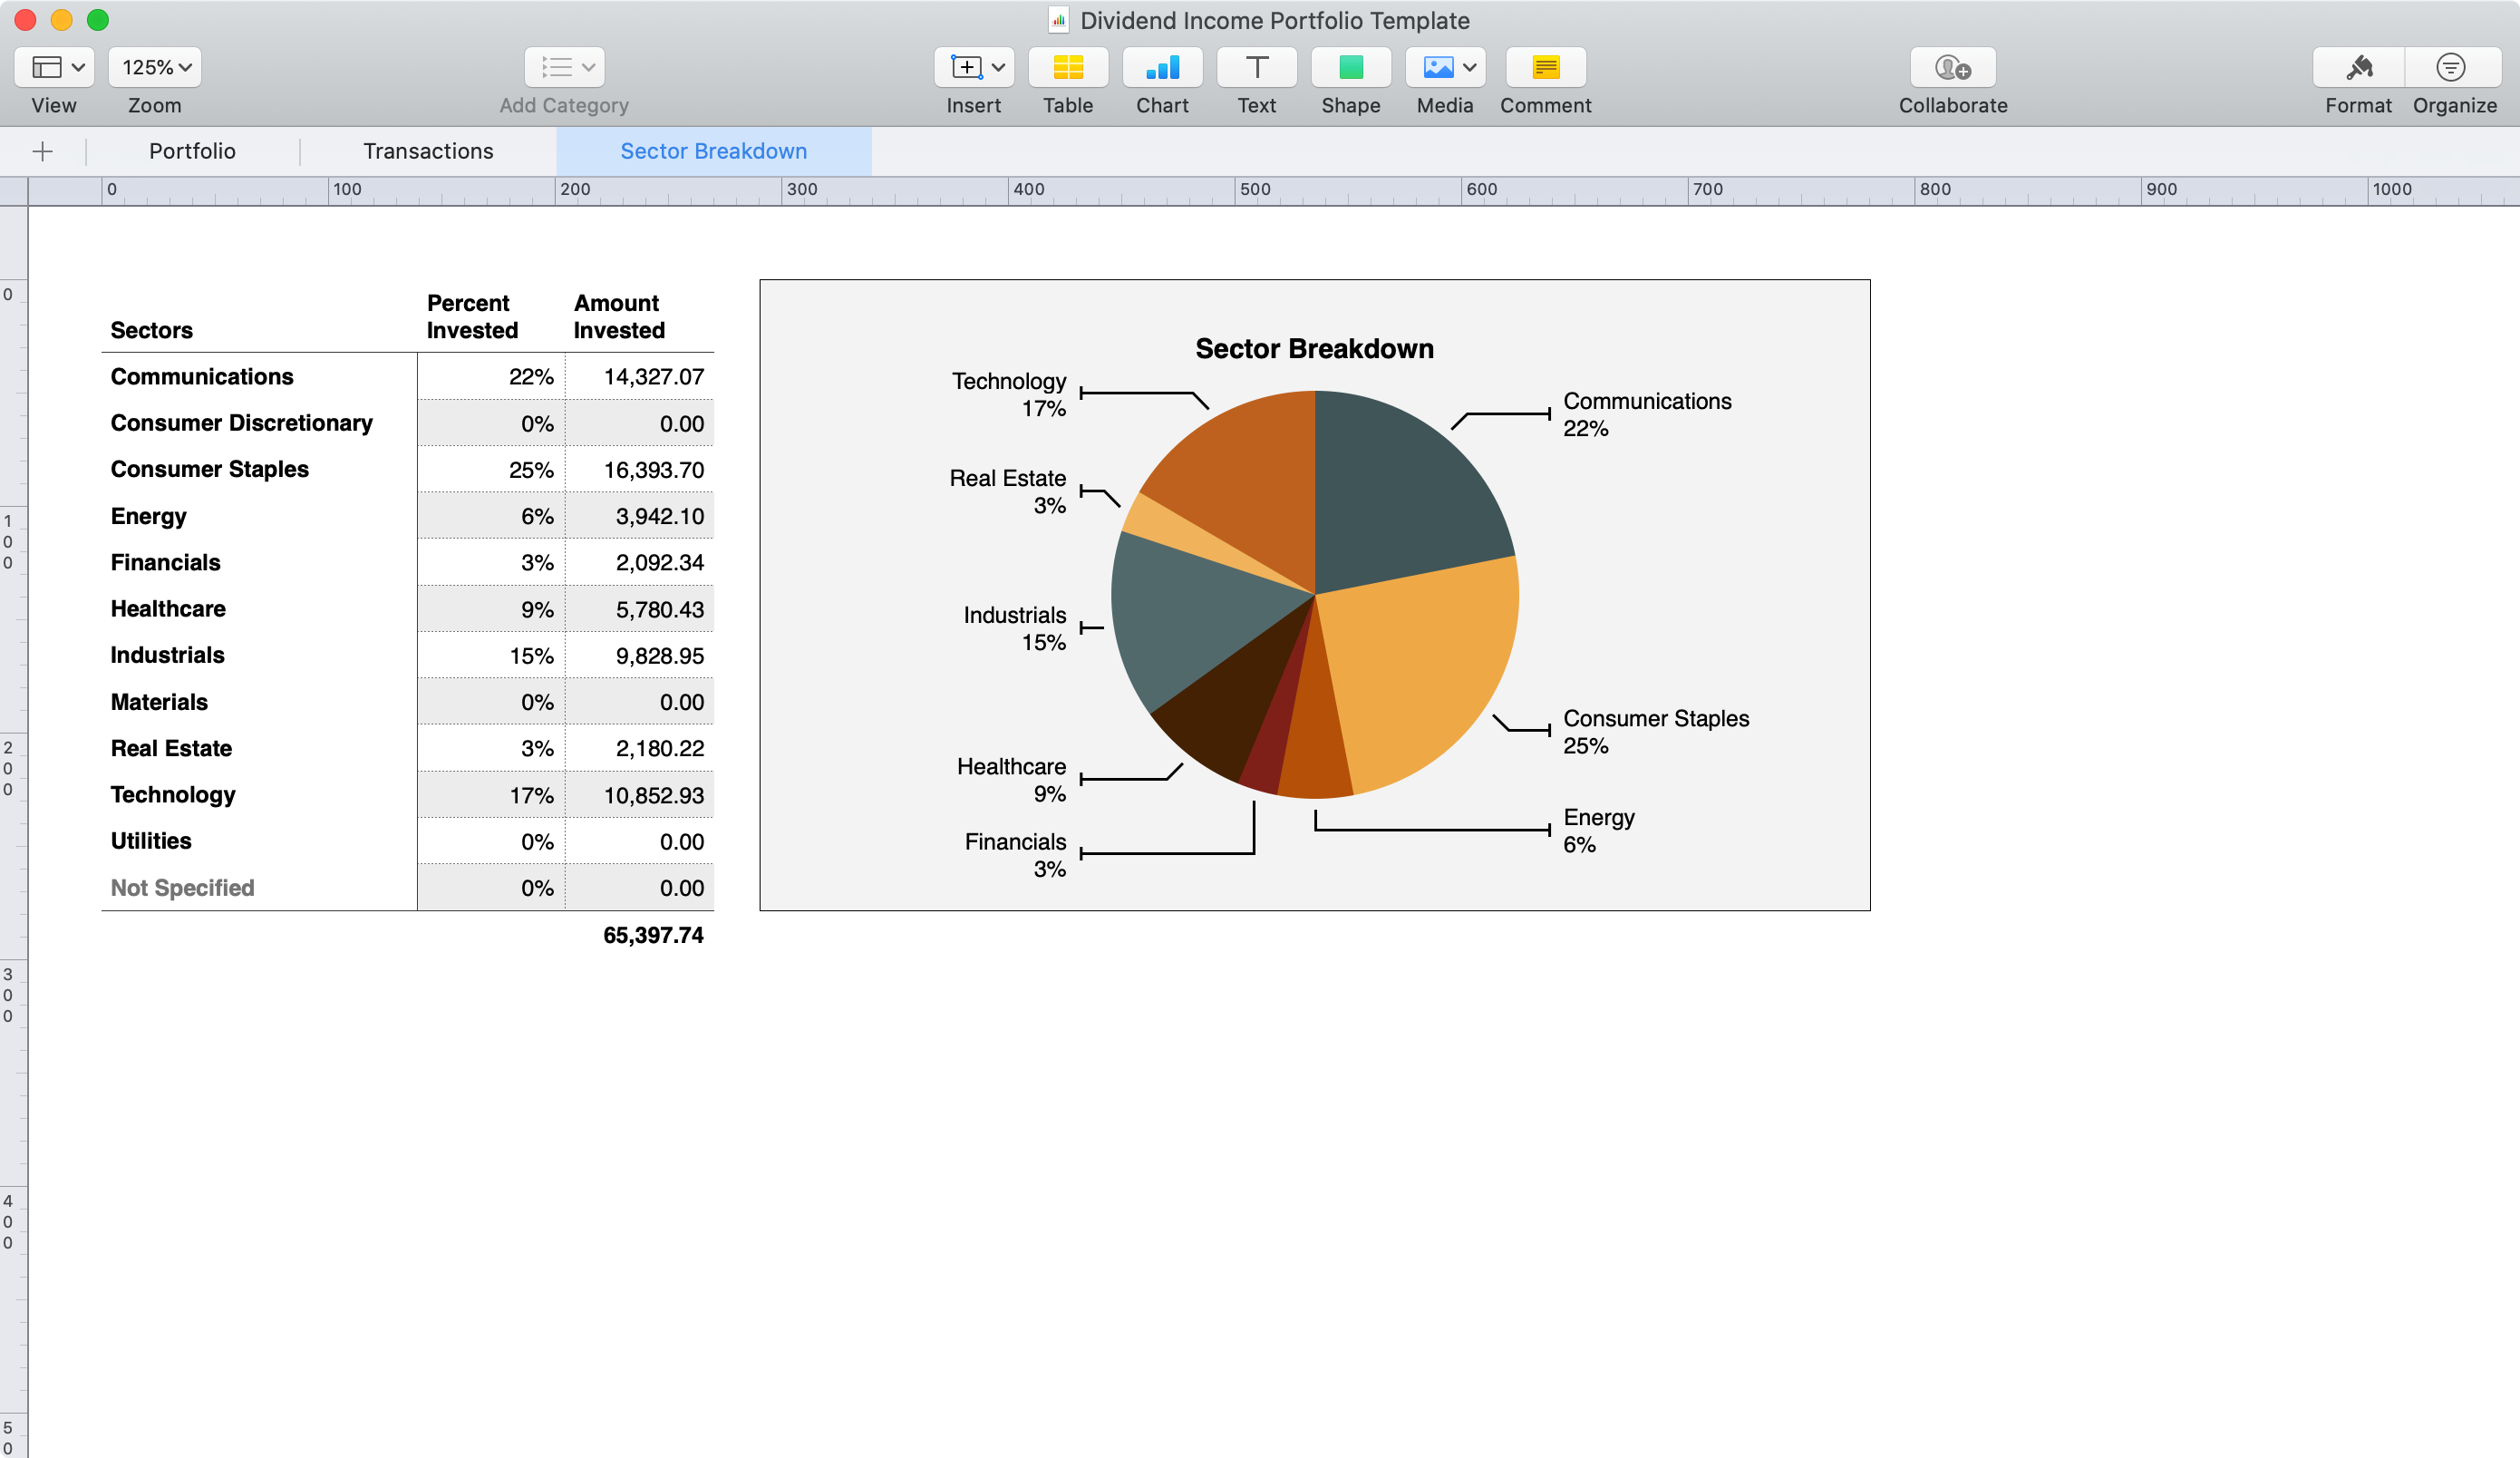
Using the Sector Breakdown sheet
When entering symbols into the Portfolio sheet, select from a drop down list of 11 sectors commonly used for sector breakdown reporting. The Sector Breakdown sheet will automatically update to reflect the percent and amount invested for each sector.